For general information, see the ADCIRC site, ADCIRC FAQ, or the ADCIRC Wikipedia page. For model documentation not yet available on the wiki, see the ADCIRC site. New content is being continuously added to the ADCIRCWiki, and material from the main ADCIRC site will be gradually transitioned over to the wiki.
File:MnasfContours3.png: Difference between revisions
Taylorgasher (talk | contribs) (C_d contours for Manning's n and depth. Log scale on x and y axes. Code (requires tightfig.m from Matlab File Exchange): d=0.1:0.1:20; g=9.81; n=0.001:0.001:0.3; [dm,nm]=meshgrid(d,n); cd=g.*nm.^2./(dm.^(1/3)); contlvls=round(logspace(-4,0,10),2,'s...) |
Taylorgasher (talk | contribs) (Taylorgasher uploaded a new version of File:MnasfContours3.png) |
| (One intermediate revision by the same user not shown) | |
(No difference)
| |
Latest revision as of 15:06, 21 January 2019
Summary
C_d contours for Manning's n and depth. Log scale on x and y axes. Code (requires tightfig.m from Matlab File Exchange): d=0.1:0.1:20; g=9.81; n=0.001:0.001:0.3; [dm,nm]=meshgrid(d,n); cd=g.*nm.^2./(dm.^(1/3)); contlvls=round(logspace(-4,0,10),2,'significant'); figure contour(dm,nm,cd,contlvls,'showtext','on') colormap(lines(1)) grid on xlabel('depth (meters') ylabel('Mannings n') title('c_d') tmp=gca; tmp.XScale='log'; tmp.YScale='log'; tmp.XMinorGrid='on'; tmp.YMinorGrid='on'; drawnow tightfig print('mnasfContours3.png','-r200','-dpng')
File history
Click on a date/time to view the file as it appeared at that time.
| Date/Time | Thumbnail | Dimensions | User | Comment | |
|---|---|---|---|---|---|
| current | 15:06, 21 January 2019 | 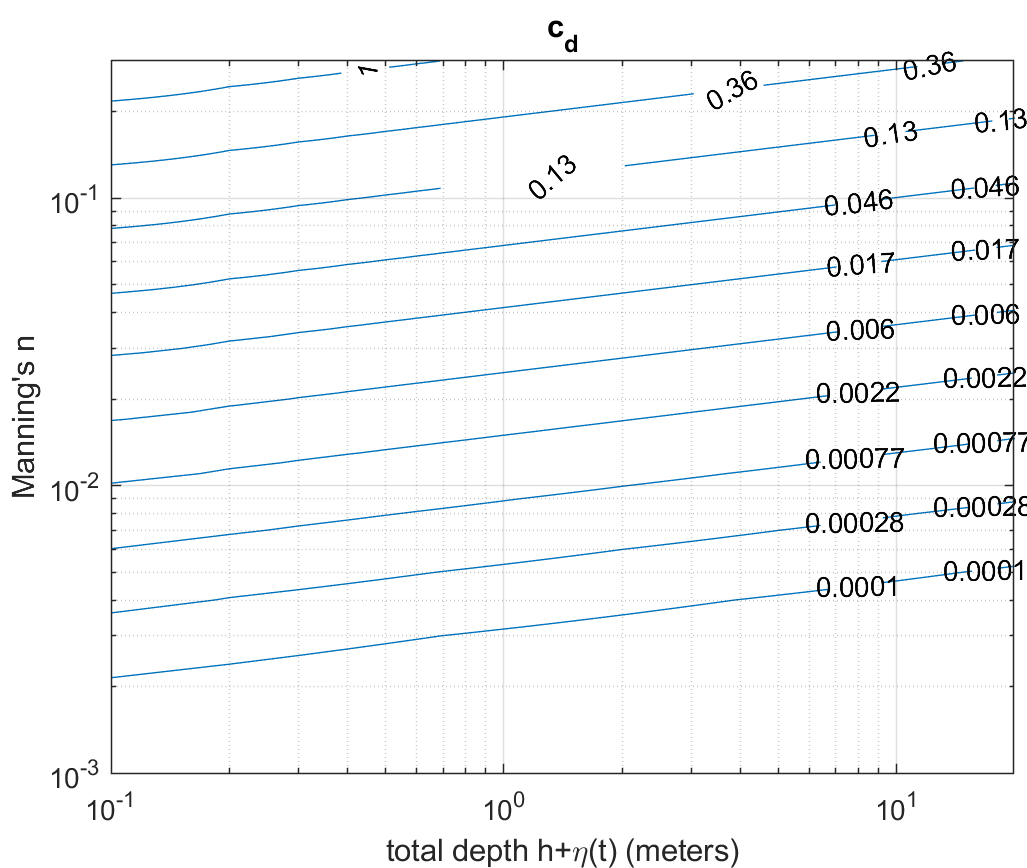 | 1,027 × 868 (80 KB) | Taylorgasher (talk | contribs) | Changed x label to be clear it's total depth. Again, code and need tightfig.m from file exchange: d=0.1:0.1:20; g=9.81; n=0.001:0.001:0.3; [dm,nm]=meshgrid(d,n); cd=g.*nm.^2./(dm.^(1/3)); contlvls=round(logspace(-4,0,10),2,'significant'); figure con... |
| 14:51, 21 January 2019 | 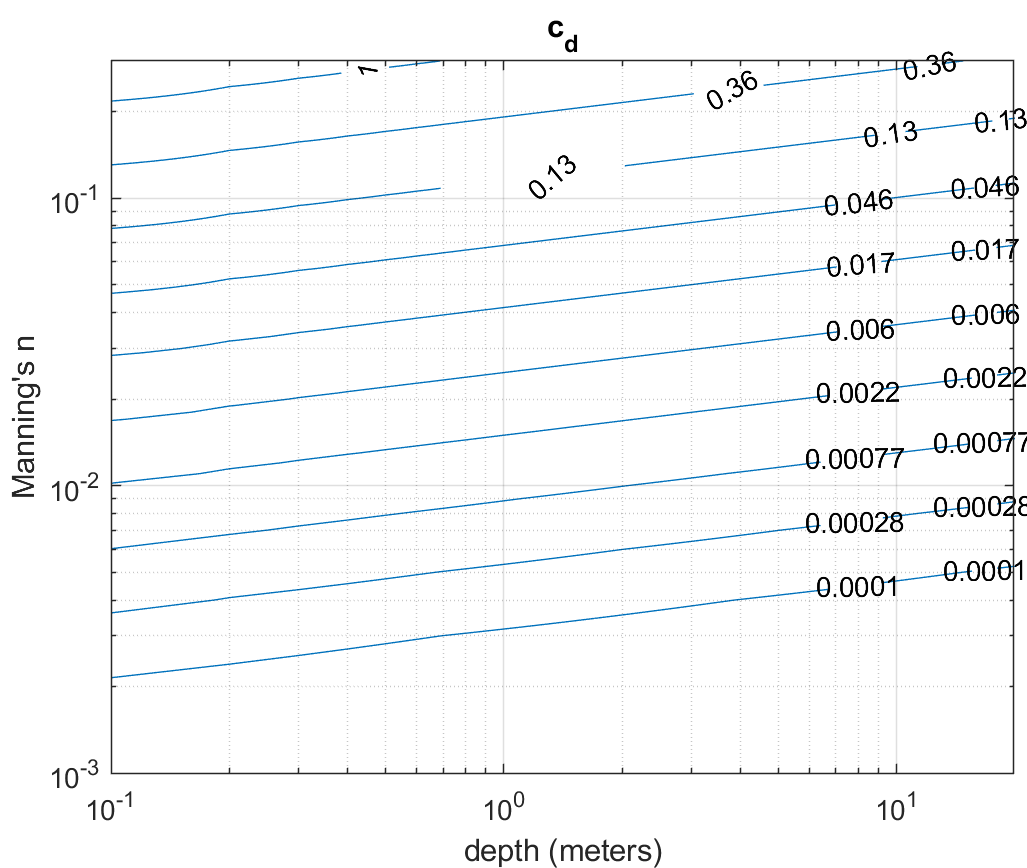 | 1,027 × 868 (78 KB) | Taylorgasher (talk | contribs) | Fixed x axis label, new code, still requires tightfig.m: d=0.1:0.1:20; g=9.81; n=0.001:0.001:0.3; [dm,nm]=meshgrid(d,n); cd=g.*nm.^2./(dm.^(1/3)); contlvls=round(logspace(-4,0,10),2,'significant'); figure contour(dm,nm,cd,contlvls,'showtext','on') co... | |
| 14:47, 21 January 2019 |  | 1,027 × 868 (78 KB) | Taylorgasher (talk | contribs) | C_d contours for Manning's n and depth. Log scale on x and y axes. Code (requires tightfig.m from Matlab File Exchange): d=0.1:0.1:20; g=9.81; n=0.001:0.001:0.3; [dm,nm]=meshgrid(d,n); cd=g.*nm.^2./(dm.^(1/3)); contlvls=round(logspace(-4,0,10),2,'s... |
You cannot overwrite this file.
File usage
The following page uses this file: